Figure XXX

Note: the final draft of this paper was not in a format suitable for the web. This is an early draft in html, but it may contain some errors and needs editing.
There are two parts to developing any force field: finding a functional form that reflects the physics and choosing the parameters required by the functional form. Much of the tedium is in the parameterization. We hypothesize that this step can be automated by large genetic algorithm computations on cycle-harvested desktop computers. By automating parameterization, exploration of functional forms should be substantially enhanced.
Given a functional form, the parameters are typically chosen to fit experimental values and/or ab initio calculations. The fitting process can be difficult because, among other reasons, functional forms usually have many local minima that tend to trap search algorithms. We are developing the JavaGenes genetic algorithm to evolve force field parameters. Genetic algorithms are somewhat less likely to fall into local minima than simulated annealing or hill climbing. Furthermore, genetic algorithms can find the pareto front for multiple objectives (e.g., match several experimental results), an impossible task for single solution search strategies. For proof of concept, we have evolved the [Stillinger and Weber 1990] published parameters for Si and F with good results. Using the techniques developed, primarily randomization of the genetic algorithm parameters, we have evolved new Stillinger-Weber parameters for Si fit to semi-empirical quantum code derived energies and forces of silicon clusters. Evolution was driven by energies and forces calculated for 2-6 Si atom clusters, and was able to predict energies for 7-8 atom Si clusters with reasonable accuracy.
Unfortunately, multi-species reactive potential functions are extremely difficult to develop. The work is hard, tedious, slow, requires great expertise and is failure prone. As a result, only a few such potential functions are available today. These include:
There are two parts to the development of any potential function:
For the current work, we used the Condor [Litzkow, et al. 1988] cycle scavenger running on about 350 SGI and Sun machines at the NASA Advanced Supercomputing (NAS) Division [www.nas.nasa.gov]. Each workstation runs a daemon that watches user IO and CPU load. When a workstation has been idle for 2 hours, a job from the batch queue is assigned to the workstation and will run until the daemon detects a keystroke, mouse motion, or high non-Condor CPU usage. At that point, the job is removed from the workstation and placed back on the batch queue. The job will eventually run again, although probably on a different machine. Typically, between 100-250 NAS machines are available for batch processing through the NAS Condor pool [www.nas.nasa.gov/Groups/Condor/] at any particular time.
Figure XXX

| NAS Condor workstation usage for June 2001. The green represents Condor enabled batch computation. Only the relatively small amount of blue indicates wasted CPU cycles. Note the regular patterns of five red peaks when workstations are in use during normal business hours. The tall blue spikes are upgrade times when Condor calculations were temporarily suspended. |
While cycle-scavenging systems can supply huge amounts of CPU, they are restricted to embarrassingly parallel problems with minimal IO requirements. This is because communication between processors is fairly slow; e.g., ethernet for the NAS Condor pool and 56Kbaud modems for seti@home! However, many important problems fit within these restrictions, including parameter studies, Monte Carlo simulations, and genetic algorithms. For example, much of the data for this paper was generated by running 2500 ~30 minute genetic algorithm (GA) jobs with randomized GA-parameters. This procedure can use thousands of processors with no interprocess communication and minimal disk IO.. As a results, 1000+ CPU hours of computation is routinely accomplished overnight without purchasing any hardware. Furthermore, the NAS Condor system is constantly improving as different groups buy new workstations and retire old ones.
GAs are search algorithms. In this case, the search is through the space of all reasonable parameters. GAs do not require gradient information, can find a variety of solutions in parallel, and do not require information about the search space. Because GAs generate a large number of solutions (the population), GAs can find the pareto front for multiple optimization objectives. The pareto front is the set of solutions, each of which satisfies at least one objective better than any other solution. This will be important when we hope to evolve parameters to fit not only calculated energies and forces, but also experimental data such as compressibility, surface reconstruction energy, surface bond lengths, vibrational properties, etc.
GAs are easy to implement but hard to use. Also, GAs are not guaranteed to find a satisfactory answer. In addition, there are a wide variety of GA techniques and many techniques have a variety of parameters that can affect the search. Examples of GA parameters include population size and the mix of mutation vs crossover. Thus, choosing the proper GA technique and parameters is a non-trivial problem. We solved this by randomizing the GA parameters.
Furthermore, GAs have a tendency to optimize the fitness function with tricks rather than finding an answer of interest. For example, a robot controller intended to traverse a cluttered environment was evolved with a fitness favoring motion without collision. The most fit individuals found some empty space and went around in small circles indefinitely. GAs can do other strange things. In our study JavaGenes effectively algebraically rearranged the potential function.
Energy = SUM all-two-body-energies + SUM all-three-body-energies + ...
The potentials we are currently interested in ignore terms with more than three bodies. Most potentials do not allow bonds to break so the two and three bodies of interest are fixed for the entire computation. We are interested in reactive potentials where the bonds cannot be predetermined. To reduce computation, reactive potentials often have a cutoff function that forces each term to zero at large atomic separations. This converts the problem from O(n3) to O(n) since only near neighbors need be considered. The Stillinger-Weber (SW) potential used in this paper only considers two and three body terms and has an exponential cutoff. The terms are:
two-body(r) = A(Br-p - r-q)cutoff
cutoff = eC/(r-a); r < a, 0 otherwise
where r is the interatomic distance and all other values are adjustable parameters.
three-body(rij,rjk,theta) = (alpha + lambda(cos(theta)
- cos(theta0))2)cutoff
cutoff = egamma/(rij- a1)
+ gamma/(rjk- a1)
where rij and rjk are the two interatomic distances, theta is the angle and all other values are adjustable parameters.
In addition, SW has an additional three-body term for fluorine triples. This term is added to the usual three-body term:
delta(rijrjk)-m cutoff
cutoff = ebeta/(rij- a2)
+ beta/(rjk- a2)
Note that this formulation is an algebraic generalization of the form found in [Stillinger and Weber 1990]. This generalization is necessary so that every 2 and 3 body has the same equation (except the extra fluorine three body term). In [Stillinger and Weber 1990] terms = 0 and factors = 1 are left out, but for JavaGenes to evolve new parameters the form must be completely general.
For this paper, the cutoff distance a, a1, and a2 are not evolved because they are for optimization. Furthermore, the preferred bond angle theta0 is not evolved since it is readily available from experiment and theoretical considerations (theta0 is the tetrahedral angle).
[Cundari and Fu 2000] used a similar technique to develop force field parameters for technetium (Tc) complexes. Instead of using differences in predicted atomic locations, Cundari and Fu used the difference of energies predicted by quantum effective core potential calculations and MM2 calculated energies with evolving parameters. Cundari and Fu found that GA evolved parameters could improve the predictive power of MM2 over parameters derived from quantum chemistry calculations by other techniques. Also, MM2 with evolved parameters accuracy on the metal-ligand complexes was comparable to MM2's accuracy on purely organic molecules.
At first we ran 30-100 single-workstation GA jobs with identical GA-parameters (except the random number seed) for each force-field-parameter search. These runs used large populations (1000-3000). The GA-parameters that worked for one search (say, Si dimers in the fitness function) would fail in a similar search (for example, Si-F dimers in the fitness function). We then ran thousands of jobs with randomized GA-parameters and small populations (100). This technique worked well for all the searches conducted.
We first reproduced the Stillinger-Weber results using Stillinger-Weber small cluster energies derived from the published Si and F parameters in the fitness function. This showed that the method can find the global, not just the local, minimum. Then, using the same Si clusters, we derived new parameters using a semi-empirical code [Menon and Subbaswamy 1993] to calculate cluster energies and forces. Menon's semi-empirical energies can be used to generate energies and forces for the multi-species potentials of interest (Si-B-N-C-Ge). The Menon semi-empirical code cannot model F so this paper concentrates on Si, although some F results are discussed.
For method details, see the Method Details section below.
Using 51 runs with carefully chosen GA-parameters, it was possible to reproduce the F two-body parameters quite precisely. With F two-body parameters fixed to the best F two-body parameters evolved, the three-body parameters were evolved to fit 51 F2+F2 conformations randomized around the minimum energy conformation. The resulting F parameters were:
F parameters
| Parameter | Published value | Evolved Value |
| A |
0.5228
|
0.5230
|
| B |
0.1128
|
0.1130
|
| C |
0.579495
|
0.579476
|
| p |
8.0
|
7.997
|
| q |
4.0
|
4.001
|
| Three body parameters | ||
| alpha |
38.295
|
39.7
|
| lambda |
-19.1475
|
-20.39
|
| gamma |
1.738
|
1.748
|
| delta |
0.0818
|
0.0835
|
| m |
4.0
|
3.978
|
| beta |
0.579
|
0.587
|
These results required hand-searching through the possible GA-parameters. However, these same GA-parameters performed poorly searching for Si-F two-body parameters. To avoid an extensive hand search through GA-parameters for each subproblem, we adopted an alternate approach: run thousands of jobs with randomized GA-parameters. Although there are many more jobs, we used smaller populations and the runs were considerably faster.
The fitness function was not randomized since, otherwise, it would be difficult to compare the results of each job. The fitness function was the difference from precalculated energies at various dimer separations. Near the minimum energy separation, this is calculated as the RMS of the distance between energies. Since energies at short distance have an absolute value orders of magnitude greater than at greater distance, energy comparison on the 'wall' at small separations were compared by:
|a - b| / (|a| + |b|)
where a and b are the energies being compared. This function always returns a value between 0 and 1. This avoids the wall having undue influence on evolution. This measure has pathological properties when a and b are of opposite sign, but on the wall all reasonable parameters generate positive energies.
Table XXX shows results evolving the Si parameters: For two-body parameters we fit the energies of 100 Si dimers spaced 0.5-3.7 angstroms apart.
Table XXX: Si two-body parameters
| Parameter | Published value | Evolved value |
| A |
7.0495
|
-4.21
|
| B |
0.602
|
1.67
|
| C |
1.0
|
1.01
|
| p |
4.0
|
-0.05
|
| q |
0.0
|
4.01
|
At first the evolved parameters seem to be wildly incorrect, but notice that C is nearly correct and that p and q are (approximately) reversed. Since C is the cutoff parameter, we can ignore the cutoff term and see if the evolved and published parameters are equivalent:
| energy(r) = A(Br-p – r-q) |
published
|
evolved
|
| initial form |
7(0.6r-4 – r-0)
|
–4.2(1.67r-0.05 – r-4.01)
|
| with A distributed |
4.2r-4 – 7r-0
|
–7.014r-0.05 +
4.2r-4.01
|
We see that JavaGenes has effectively performed algebra on the functional form!
Using the same procedure, the F two-body and Si-F two-body parameters were evolved. The published and evolved parameters were:
Table XXX: F two-body and Si-F two-body parameters
| Parameter | F published | F evolved | Si-F published | Si-F evolved |
| A |
0.52
|
0.999
|
21.2
|
-5.1
|
| B |
0.11
|
0.167
|
0.5
|
2.8
|
| C |
0.58
|
1.27
|
1.3
|
1.3
|
| p |
8
|
7.299
|
3
|
1.6
|
| q |
4
|
4.01
|
2
|
3.4
|
Here the differences cannot be explained by algebraic rearrangement alone, although p and q are nearly reversed in each case. However, figure XXX shows that the energy and force curves for all three dimers are essentially identical in all three cases:
Figure XXX: comparison of published vs evolved two-body energies and
forces
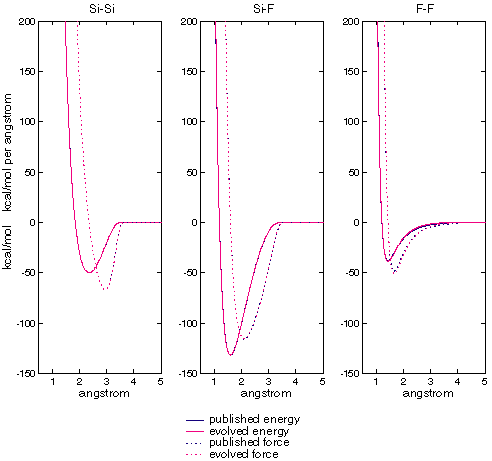
| These charts compare the energies and forces generated by published and evolved parameters for Si, F, and Si-F dimers. The horizontal axis is separation, the vertical axis energy and force. Note that in all cases the curves are essentially on top of each other. |
A, B, and C are compensating for inaccuracies in p and q. There is, apparently, more than one way to skin an atomic cat.
| Parameter | Published value | Evolved Value |
| A |
7.0495
|
-4.51
|
| B |
0.602
|
1.68
|
| C |
1
|
1.06
|
| p |
4
|
0.015
|
| q |
0
|
4.066
|
| Three body parameters | ||
| alpha |
0
|
-1.68
|
| lambda |
21
|
30.5
|
| gamma |
1.2
|
1.289
|
Figure XXX compares the energies generated by Stillinger-Weber with published parameters and those generated by the best evolved individual. This is done for the 2-6 atom clusters used in the fitness function and 7-8 atom clusters that were not. Note that the fit is quite good in both cases.
Figure XXX
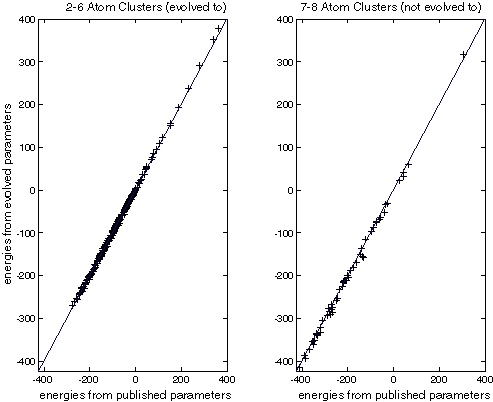
| These charts compare the energies calculated for Si clusters. The horizontal axis is the energy calculated with the published SW parameters. The vertical axis is the energy calculated with evolved SW parameters. Crosses on the line indicate a perfect match. All energies are in kcal/mol. |
Figure XXX compares the energy and force curves generated by the published and evolved Stillinger-Weber parameters. The match is very close but not quite exact. Genetic algorithms are often good a getting close to an optimum, but not for the final refinement. For computational chemistry, where the data for the fitness function is necessarily a precise reflection of reality this limitation is not serious and perhaps even an advantage.
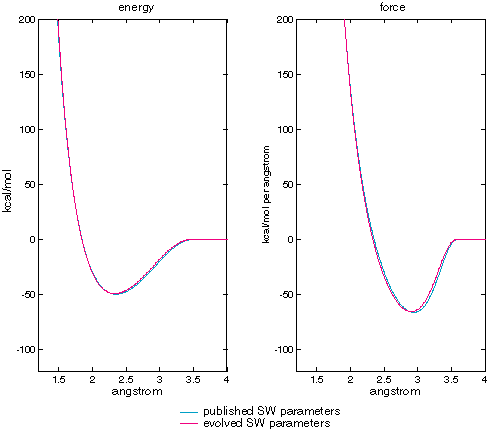
| Stillinger-Weber published vs evolved parameters calculating two-body term energy and force as a function of atomic separation. |
Figure XXX compares energies for the three-body term only. We see that the fit is quite good, although not as close as for the two-body term. As the three-body term tends to generate smaller energies than the two-body term, it doesn't affect evolution as strongly.
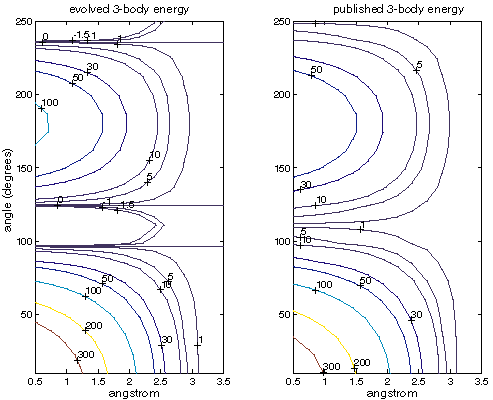
| Comparison of the three-body energies for evolved and published SW parameters. The horizontal axis is the distance between the central atom and both other atoms (they are the same distance). The vertical axis is the angle formed around the central atom. Note that the evolved energies go slightly negative as alpha is less than zero. All energies are in kcal/mol. |
Parameters for the Si dimer were evolved using semi-empirical energies and forces in the fitness function. Since the semi-empirical energies are positive at longer separations, the fitness function fits to forces in this region instead of energies (the SW functional form cannot simultaneously produce a negative minimum energy and positive values in this region). 2500 jobs were run with randomized GA-parameters and the best taken. Table XXX contains the results:
Figure XXX: comparison of parameters published, evolved to SW,
and evolved to semi-empirical dimer energies
| Parameter | Published | Evolved to SW | Evolved to semi-empirical |
| A |
7.0495
|
-4.21
|
-0.66
|
| B |
0.602
|
1.67
|
14.23
|
| C |
1
|
1.01
|
1.48
|
| p |
4
|
-0.05
|
-2.50
|
| q |
0
|
4.01
|
18.67
|
The parameters evolved to the semi-empirical energies and forces are quite different from those evolved to SW. Figure XXX compares the energy and force curves.
Figure XXX
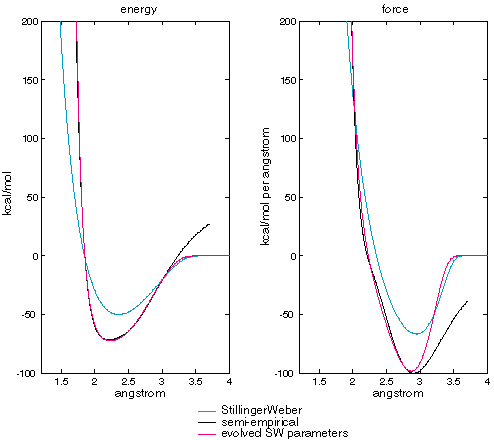
| Stillinger-Weber published vs evolved parameters calculating two-body term energy and force as a function of atomic separation. |
The evolved parameters match the semi-empirical data much better than the published parameters. The major divergence between SW with evolved parameters and the semi-empirical results is at long separations (> 3 angstrom) where the semi-empirical energies are positive and the Stillinger-Weber form requires energies and forces to go to zero. This requires a change in the fitness function, which is based on differences in energies for most separations, but uses at differences in forces at long separations. There is also a reversal of the derivative of the semi-empirical force curve between 2 and 2.7 angstroms that the SW functional form cannot match.
Having found a good match for the three-body parameters, we evolved all Si parameters to a fitness function based on 2-6 atom clusters. The dimers were handled as above, and the 3-6 atom clusters were the minimum conformation calculated by Menon's semi-empirical code plus a number of conformations randomized around this minimum. This experiment ran 1000 jobs with randomized GA-parameters. One of these parameters was to import the previously evolved two-body parameters as a starting point for part or all of the population.
Figure XXX: comparison of parameters published, evolved to SW,
and evolved to semi-empirical cluster energies
| Parameter | Published | Evolved to SW | Evolved to semi-empirical |
| alpha |
0
|
-1.68
|
11.7
|
| gamma |
21
|
30.5
|
10.9
|
| lambda |
1.2
|
1.289
|
1.38
|
The best of these jobs not only matched the energies of the 2-6 atom dimers, but also matches a number of 7 and 8 atom clusters randomized around their minimums as seen in figure XXX.
Figure XXX: evolved parameters generate energies very close to semi-empirical
energies, even
for clusters not used in the fitness function (not evolved to).
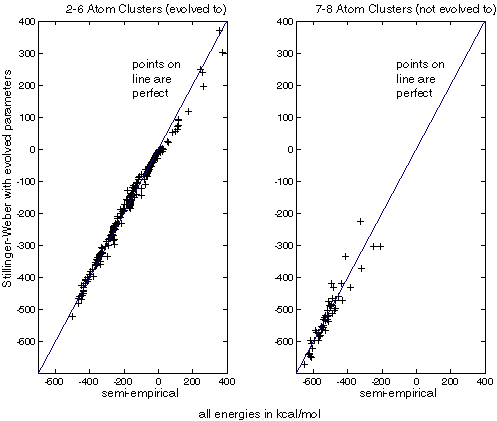
| These charts compare the energies calculated for Si clusters. The horizontal axis is the energy calculated with Menon's semi-empirical method. The vertical axis is the energy calculated with evolved SW parameters. Crosses on the line indicate a perfect match. |
We see that the energies for 2-6 atom dimers match extremely well, as might be expected since these dimers were used in the fitness function. However, SW with evolved parameters predicted the energies of 7 and 8 atom dimers very well, suggesting that the evolved parameters are at least somewhat transferable. Note that a different set of clusters were used for this study than evolution driven by Stillinger-Weber energies. This is because the randomization code produces a different set of conformations each time it is run.
In addition the predicted energies, figure XXX examines the two-body energies of the new potential.
Figure XXX
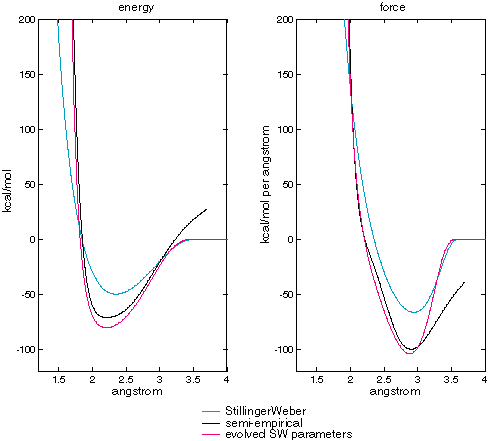
| Dimer energies and forces for published and evolved SW potential, and Menon's semi-empirical code. |
Although they are much closer than energies and forces generated by the published Stillinger-Weber parameters, figure XXX shows that the energies and forces generated by evolved parameters are somewhat different from the semi-empirical energies and forces. Specifically, the minimum energy is lower. By examining the energies on the three-body SW term in isolation we can gain some insight:
Figure XXX
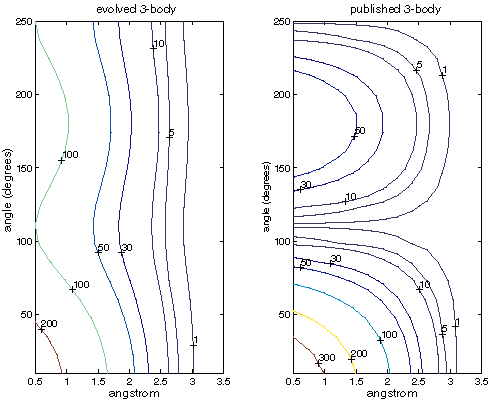
| Contour map of Si three-body energies in kcal/mol as a function of angle and separation from the central atom. |
Examining the three-body SW term alone, figure XXX shows that the much higher three-body energies may be compensating for the lower two-body energies. Note that these are the energies from the SW three-body term alone and no comparable energy exists in Menon's semi-empirical code. This makes some sense as the cutoff for the SW three-body term depends on the lengths of the two involved bonds. Thus, evolution has moved some of the functionality of the two-body term into the three-body term and sacrificed dimer accuracy as a result. Also note that at long separations the evolved parameters show little preference for any angle.
At the end of each run, the best individual evolved by any of the jobs was examined. All the results reported above represent the best individual from all jobs for a given run.
Each parameter is assigned a set of limits within which it is allowed to evolve. In general, A, B, alpha, lambda, and delta shared limits because they are all factors or isolated terms; p, q and m shared limits because they are all exponents, and C, gamma, and beta shared limits because they determine cutoff functions.
Cutoff parameters a1, a2, and the preferred angle theta0 were not evolved. The cutoffs are an optimization for which it is very difficult to write a fast fitness function, and the preferred angle is known from experiment.
JavaGenes can form a new fitness function from a weighted linear combination of fitness functions.
While it is possible to randomize the fitness function, and we tried it, this doesn't work very well since it is difficult to compare the results of each run.
Table xxx
| Conformations | Describes the atomic conformations used in the fitness function |
| Conformation sets | In many studies, several sets of conformations were used. The fitness value for each set was calculated and a linear combination of the fitness for each set was the final fitness |
| Target energies (and forces) generated by | Describes the source of the energies and forces used in the fitness function. This was always either the Stillinger-Weber potential with published parameters or the Menon semi-empirical code |
| Energy (and force) comparison | Describes the function used to compare energies and/or forces with the target energies and/or forces |
| Number of jobs | Number of separate, single-workstation jobs in the run |
| Population size | Size of the population |
| Children per generation | Number of children generated for each generation |
| Number of generations | Number of generations |
| Transmission operators | Mix of crossover and mutation transmission operators |
| Interval crossover parameter | For the interval crossover transmission operator, the amount the interval between parental values of a parameter grew or shrank before choosing a random value within the interval. |
| Mutation frequency | The probability that any one GA-parameter was mutated by the mutation transmission operator. |
| Mutation standard deviation | The mutation operator modified GA-parameters by choosing randomly from a Gaussian distribution centered on the parental value. This vale is expressed as a fraction of the allowed interval for a GA-parameter. |
| Stillinger-Weber parameter varies from | the range within which a Stillinger-Weber parameter could vary. Note that the interval crossover operator could be set to ignore this interval. |
| Immigrants | When searching for both the two- and three-body parameters, JavaGenes can initialize the population with two-body values taken from a run that focused on the two-body parameters. Any fraction (including all) of the initial population could have the two-body terms set this way. Although the initial two-body parameters were set, these parameters were allowed to evolve. Fixing these permanently didn't work well when evolving towards semi-empirical energies and forces. |
We now examine list the GA-parameters used for each run discussed in this paper.
| Conformations | 100 dimers evenly spaced from 0.5-4.37 angstroms |
| Target energies generated by | SW with published parameters |
| Energy comparison | RMS of |a - b| / (|a| + |b|) |
| Number of jobs | 51 |
| Population size | 1000 |
| Children per generation | 1000 |
| Number of generations | 5000 |
| Transmission operators | 75% interval crossover, 25% mutation |
| Interval crossover parameter | 2 |
| Mutation frequency | 0.5 |
| Mutation standard deviation | 0.25 |
| A,B varies from | -100 to 600 |
| p,q varies from | 0 to 24 |
| C varies from | 0 to 6 |
Table XXX
| Conformations | 51 F2+F2 complexes randomized around the low energy conformation |
| Energy comparison | RMS |
| Population size | 2000 |
| Children per generation | 2000 |
| Number of generations | 15000 |
All other parameters were the same as in the fluorine two-body run.
| Conformation sets | 30 "wall" dimers evenly spaced from
|
| Target energies generated by | SW with published parameters |
| Energy comparison | RMS of |a - b| / (|a| + |b|) on wall
RMS elsewhere Each set of conformations generated a separate value and these were summed to get the fitness |
| Number of jobs | 2501 |
| Population size | 100 |
| Children per generation | 2000 |
| Number of generations | 200 |
| Transmission operators | [0-5] interval crossover, [1-30] mutation |
| Interval crossover parameter | [0.3 to 3] |
| Interval crossover not limited to interval | 50% |
| Mutation frequency | [0.1 to 0.9] |
| Mutation standard deviation | [0.1 to 0.9] |
| A,B varies from | [-100 to -50] to [75 to 150] |
| p,q varies from | 0 to [12 to 24] |
| C varies from | 0 to [3 to 8] |
| Conformation sets |
All other clusters including and randomized around the minimum energy (calculated with Menon's semi-empirical code) |
| Target energies generated by | SW with published parameters |
| Energy comparison | RMS of |a - b| / (|a| + |b|) on wall
RMS elsewhere Each set of conformations generated a separate value and these were summed to get the fitness |
| Number of jobs | 1001 |
| Immigrants | 25% jobs initial population started with best two-body evolved parameters.
25% jobs half of initial population started with best two-body evolved parameters |
All other parameters were the same as for the Si-Si/Si-F/F-F studies.
Table xxx
| Conformation sets | 39 "far wall" dimers evenly spaced from 0.5 - 1.728 angstroms
7 "near wall" dimers evenly spaced from 1.599-1.793 angstroms 44 "minimum" dimers evenly spaced from 1.793 - 3.183 angstroms 41 "tail" dimers evenly spaced from 2.407 - 3.7 angstroms All other clusters including and randomized around the minimum energy (calculated with semi-empirical code [reference]) 34 6-atom clusters |
| Target energies generated by | Menon semi-empirical code |
| Energy and force comparisons | RMS of |a - b| / (|a| + |b|) on near and far wall
RMS on minimum RMS of |a - b| / (|a| + |b|) on force for tail Each set of conformations generated a separate value and these were summed to get the fitness. The near wall value was multiplied by 0.5 before the summation. |
All other parameters were the same as the run searching for Si-Si two-body parameters with Stillinger-Weber published parameter generated energies.
Table xxx
| Conformation sets | 39 "far wall" dimers evenly spaced from 0.5 - 1.728 angstroms
7 "near wall" dimers evenly spaced from 1.599-1.793 angstroms 44 "minimum" dimers evenly spaced from 1.793 - 3.183 angstroms 41 "tail" dimers evenly spaced from 2.407 - 3.7 angstroms |
| Target energies generated by | Menon semi-empirical code |
| Energy and force comparisons | RMS of |a - b| / (|a| + |b|) on near and far wall
RMS on minimum and 3-6 atom clusters RMS of |a - b| / (|a| + |b|) on force for tail Each set of conformations generated a separate value and these were summed to get the fitness. The near wall value was multiplied by 0.5 before the summation. |
All other parameters are the same as the Si cluster run with Stillinger-Weber published parameter energies in the fitness function.
[Cundari and Fu 2000] T. R. Cundari, W. T. Fu, Inorganica Chemica Acta, "Genetic Algorithm Optimization of a Molecular Mechanics Force Field for Technetium," Inorganica Chimica Acta, 300302, pages 113-124, 2000.
[Drexler 1992] K. Eric Drexler, Nanosystems: Molecular Machinery, Manufacturing, and Computation, John Wiley & Sons, Inc..
[Globus, et. al. 1999] Al Globus, John Lawton, and Todd Wipke, "Automatic Molecular Design using Evolutionary Techniques," Nanotechnology, Volume 10, Number 3, September 1999, pages 290-299.
[Hunger, et. al. 1996] J. Hunger, S. Beyreuther and G. Huttner, “Modeling of tripod Metal Compounds RCH2C(CH2PR'R")3MLn: Optimization of Force Field Parameters by Genetic Algorithms,” Journal of Molecular Modeling 2, 257, 1996.
[Hunger, et. al. 1998] J. Hunger, S. Beyreuther, G. Huttner, K. Allinger, U. Radelof and L. Zsolnai, “How to Derive Force Field Parameters by Genetic Algorithms: Modelling tripod-Mo(CO)3 Compounds as an Example,” European Journal of Inorganic Chemistry, pages 693-702, 1998.
[Hunger and Huttner 1999] J. Hunger and G. Huttner, “Optimization and Analysis of Force Field Parameters by a Combination of Genetic Algorithms and Neural Networks,” Journal of Computational Chemistry, volume 20, pages 455-471, 1999.
[Litzkow, et al. 1988] M. Litzkow, M. Livny, and M. W. Mutka, "Condor
- a Hunter of Idle Workstations,'' Proceedings of the 8th International
Conference of Distributed Computing Systems, pages 104-111,
June 1988. See http://www.cs.wisc.edu/condor.
[Menon and Subbaswamy 1993] Madhu Menon and K. R. Subbaswamy, "Nonorthogonal Tight-Binding Molecular-Dynamics Study of Silicon Clusters," Physical Review B, Volume 47, Number 19, pages 754-759, 15 May 1993.
[Mohamadi, et. al. 1990] F. Mohamadi, N. G. J. Richards, W. C. Guida, R. Liskamp, M. Lipton, C. Caufield, G. Chang, T. Handrickson, W. C. Still, Journal of Computational Chemistry, volume 11, pages 440-467, 1990.
[Stillinger and Weber 1990] Frank H. Stillinger and Thomas A. Weber, “Dynamical Branching During Fluorination of the Dimerized Si(100) Surface: A Molecular Dynamic Study, Journal of Chemical Physics, 92(10), pages 6239-6245, 15 May 1990.
[Tersoff 1989] J. Tersoff, "Modeling Solid-State Chemistry: Interatomic Potentials for Multicomponent Systems," Physical Review B, volume 93, number 8, pages 5566-5568, 15 March 1989.