The theory of atoms in molecules, invented by Richard Bader, is gaining acceptance as an objective way to describe molecular structure and to predict a wide variety of molecular properties. The theory uses the topology of derivatives of the electronic charge density - which is a scalar field in three dimensional space and a quantum mechanical obserervable - to objectively and unambiguously reveal the following (and more) about any molecule:
This is in contrast to analyses based on molecular orbitals (MOs). MOs are not quantum mechanical observables. MOs are projections onto an (essentially arbitrary) set of basis functions. These basis functions are then, often, re-combined by eye and/or selectectively highlight to fit the data.
The theory of atoms in molecules (AIM) is compatible, or more precisely "upwards compatible", with a number of other successful, more narrowly applicable, theories. In particular, it provides objective justification, from the principles of quantum mechanics, for the theory of frontier orbitals, the theory of Lewis electron pairs, and the valence shell electron pair repulsion (VSEPR) model of molecular geometry. In cases where these other theories differ from the theory of atoms in molecules, it is the latter that agrees with experiment.
Perhaps the most agreeable feature of the theory of atoms in molecules, from this author's perspective, is that it lends itself so well to visualization using diagrams and computer graphics. Because of this, relatively advanced physical and chemical concepts can be communicated to a wider-than-usual audience. Undergraduates and indeed even the lay-person can experience real insight into the micro-world via computer graphic illustration of Bader's theory of atoms in molecules.
To this end I would like to propose, advocate, and announce some initial steps in the creation of an on-line pedagogic and reference resource relating to the theory of atoms in molecules. It consists of computer graphic images and their associated data for a growing collection of small molecules. The images illustrate properties of the molecules using visualization techniques drawn from the theory of AIM. The associated data is sufficient for replication of the computations that lead to the electronic structure data and the post-processing that led to the images themselves. Also, associated data in the form of three-dimensional polygons (in VRML) is included. The entire database is available on the world wide web, so that anyone may look at it or contribute to its expansion.
In addition to the work of Bader and those influenced by him, the
present work derives much inspiration from the beautiful book of
charge density and molecular orbital images by Hout et al [1]. In
fact, the present work is merely an attempt at an updated version of
[1], but presented using the theory of AIM and taking advantage of the
continuing revolution in computer capabilities via:
The idea of this project is not unique. The work of Gabor Csonka has gone in this direction already. The present work is also inspired by the Klotho project, though its emphasis is on other aspects of chemistry. The potential for coupling or unification in significant.
Inspired directly from [1], we adopt the following visual style: For each molecule, a group of images showing the molecular graph (bonding topology) and some isosurfaces of the laplacian of the charge density are shown. Each image can be clicked on to diplay the same image at higher resolution. The Gaussian 94 input used to generate the data and the wavefunction file output by gaussian and used to generate the graphics are available as well so that the data may be reproduced, analyzed, and critiqued.
All simulations were done with Gaussian 94 using density functional theory at the b3lyp/6-311++G(2d,2p)//b3lyp/6-311++G(2d,2p) level of theory.

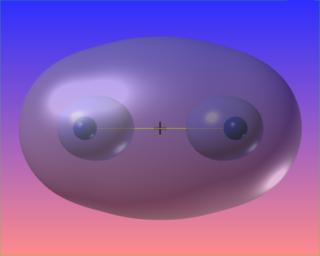
The zero surface of the Laplacian completely and symmetrically surrounds the bond critical point. This is the visual signature of the covalent (shared) nature of the bond.

Again, three-dimensions are superfluous. Note the difference between this case and H2 above.

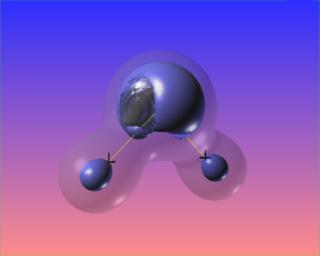
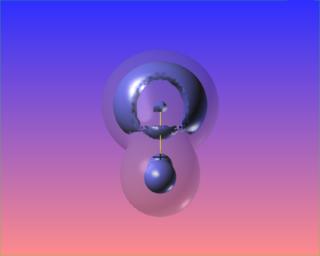
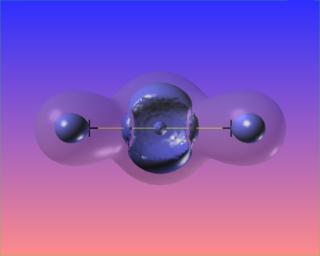
Changing the value of the iso-surface of the Laplacian causes the bonded charge concentrations to vanish, but the lone pairs take on distinct identities. The core electron concentrations of each atom are visible as well.
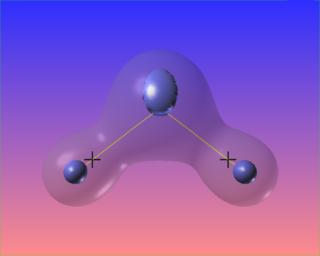
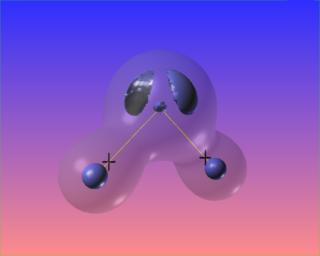
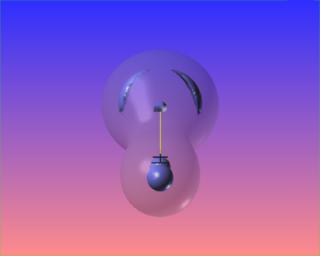
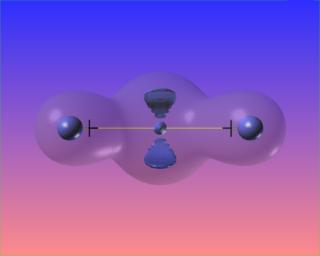
We can also highlight regions of "charge depletion" by selecting one or more positive valued isosurfaces of the Laplacian, here shown in red.
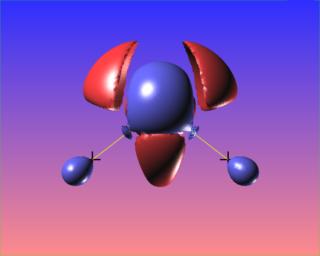
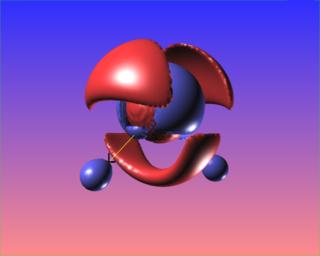
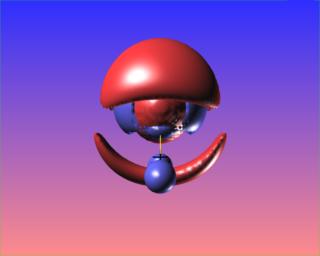
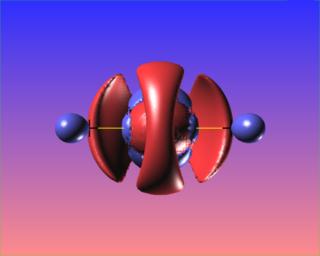
Vrml holds promise for this type of visualization, though the file sizes, network bandwidth, and rendering speed required to support complex models like the ones pictured here are still problematic. For example, in order to get reasonable speed, we have to significantly reduce the resolution of our water molecule in vrml. However, once it is on your machine, you are free to view it from any position: Here is a vrml version of water at lower resolution
The reactive surface, lap(rho)=0, does not surround the O-O bond critical point in hydrogen peroxide. This is indicative of a weak bond subject to nucleophilic attack. Here are four views of the molecule showing the reactive surface as well as surfaces of negative Laplacian:


Here again regions of (fairly mild) charge depletion are shown in red:


Here the N-N bond critical point is surrounded by the reactive surface, but the accumulation of charge along the N-N bond is towards the N atoms, and is not visible at the chosen contour levels. However, the N-H bonded charge accumulations are clear to see.


It would be very interesting to visualize this compound reacting with platinum, as it does when Hydrazine is used as a monopropellant.
Here is a little more than on quadrant of an ethylene molecule. The elliptic nature of the C-C bond is apperant, as is the significant accumulation of charge in the bonding region.


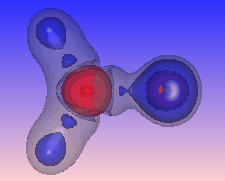
The following are three views of the Laplacian of the electronic charge density for formaldehyde. The only difference is the level of the blue contour. The bond paths and bond critical points are absent from this picture.
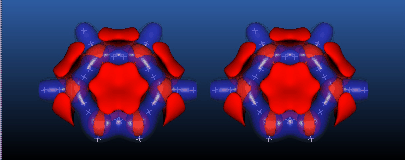
As a final example, we show two stereo views of the topology of the Laplace field of ortho-Benzyne C6H4. Here, rather than plotting the bond critical points, we plot the local minima of the Laplacian as blue crosses. Note the existence of the extrema in the Laplacian at the biradical reactive site(s).
A pictorial approach to molecular structure and reactivity. R.F. Hout, W.J. Pietro, Warren J. Hehre. New York : Wiley, 1984.
To companion papers.
 Web Work: Creon Levit